4 Item Probability Plots
Example: Bullying in Schools
To demonstrate mixture modeling in the training program and online resource components of the IES grant we utilize the Civil Rights Data Collection (CRDC)9 data repository. The CRDC is a federally mandated school-level data collection effort that occurs every other year. This public data is currently available for selected latent class indicators across 4 years (2011, 2013, 2015, 2017) and all US states. In this example, we use the Arizona state sample. We utilize six focal indicators which constitute the latent class model in our example; three variables which report on harassment/bullying in schools based on disability, race, or sex, and three variables on full-time equivalent school staff hires (counselor, psychologist, law enforcement). This data source also includes covariates on a variety of subjects and distal outcomes reported in 2018 such as math/reading assessments and graduation rates.
Load packages
library(tidyverse)
library(haven)
library(glue)
library(MplusAutomation)
library(here)
library(janitor)
library(gt)
library(cowplot)
library(DiagrammeR)
4.1 Variable Description
| LCA indicators1 | ||
| Name | Label | Values |
|---|---|---|
| leaid | District Identification Code | |
| ncessch | School Identification Code | |
| report_dis | Number of students harassed or bullied on the basis of disability | 0 = No reported incidents, 1 = At least one reported incident |
| report_race | Number of students harassed or bullied on the basis of race, color, or national origin | 0 = No reported incidents, 1 = At least one reported incident |
| report_sex | Number of students harassed or bullied on the basis of sex | 0 = No reported incidents, 1 = At least one reported incident |
| counselors_fte | Number of full time equivalent counselors hired as school staff | 0 = No staff present, 1 = At least one staff present |
| psych_fte | Number of full time equivalent psychologists hired as school staff | 0 = No staff present, 1 = At least one staff present |
| law_fte | Number of full time equivalent law enforcement officers hired as school staff | 0 = No staff present, 1 = At least one staff present |
| 1 Civil Rights Data Collection (CRDC) | ||
Variables have been transformed to be dichotomous indicators using the following coding strategy
Harassment and bullying count variables are recoded 1 if the school reported at least one incident of harassment (0 indicates no reported incidents).
On the original scale reported by the CDRC staff variables for full time equivalent employees (FTE) are represented as 1 and part time employees are represented by values between 1 and 0.
Schools with greater than one staff of the designated type are represented by values greater than 1.
All values greater than zero were recorded as 1s (e.g., .5, 1,3) indicating that the school has a staff present on campus at least part time.
Schools with no staff of the designated type are indicated as 0 for the dichotomous variable.
4.2 Prepare Data
df_bully <- read_csv(here("data", "crdc_lca_data.csv")) %>%
  clean_names() %>%
  dplyr::select(report_dis, report_race, report_sex, counselors_fte, psych_fte, law_fte)
4.3 Descriptive Statistics
dframe <- df_bully %>%
pivot_longer(
c(report_dis, report_race, report_sex, counselors_fte, psych_fte, law_fte),
names_to = "Variable"
) %>%
group_by(Variable) %>%
summarise(
Count = sum(value == 1, na.rm = TRUE),
Total = n(),
.groups = "drop"
) %>%
mutate(`Proportion Endorsed` = round(Count / Total, 3)) %>%
select(Variable, `Proportion Endorsed`, Count)
gt(dframe) %>%
tab_header(
title = md("**LCA Indicator Endorsement**"),
subtitle = md(" ")
) %>%
tab_options(
column_labels.font.weight = "bold",
row_group.font.weight = "bold"
)| LCA Indicator Endorsement | ||
| Variable | Proportion Endorsed | Count |
|---|---|---|
| counselors_fte | 0.453 | 919 |
| law_fte | 0.124 | 251 |
| psych_fte | 0.467 | 947 |
| report_dis | 0.042 | 85 |
| report_race | 0.102 | 206 |
| report_sex | 0.168 | 340 |
Save as image
4.4 3-Class Probability Plot
Continuing the example from the bookdown, use the plot_lca function provided in the folder to plot the item probability plot. This function requires one argument:
- model_name: The name of the Mplus readModels object (e.g., output_enum$c3_bully.out)
source(here("functions", "plot_lca.R"))

# Extract outputs from the enumeration folder
output_enum <- readModels(here("enum"), filefilter = "bully", quiet = TRUE)

plot_lca(model_name = output_enum$c3_bully.out)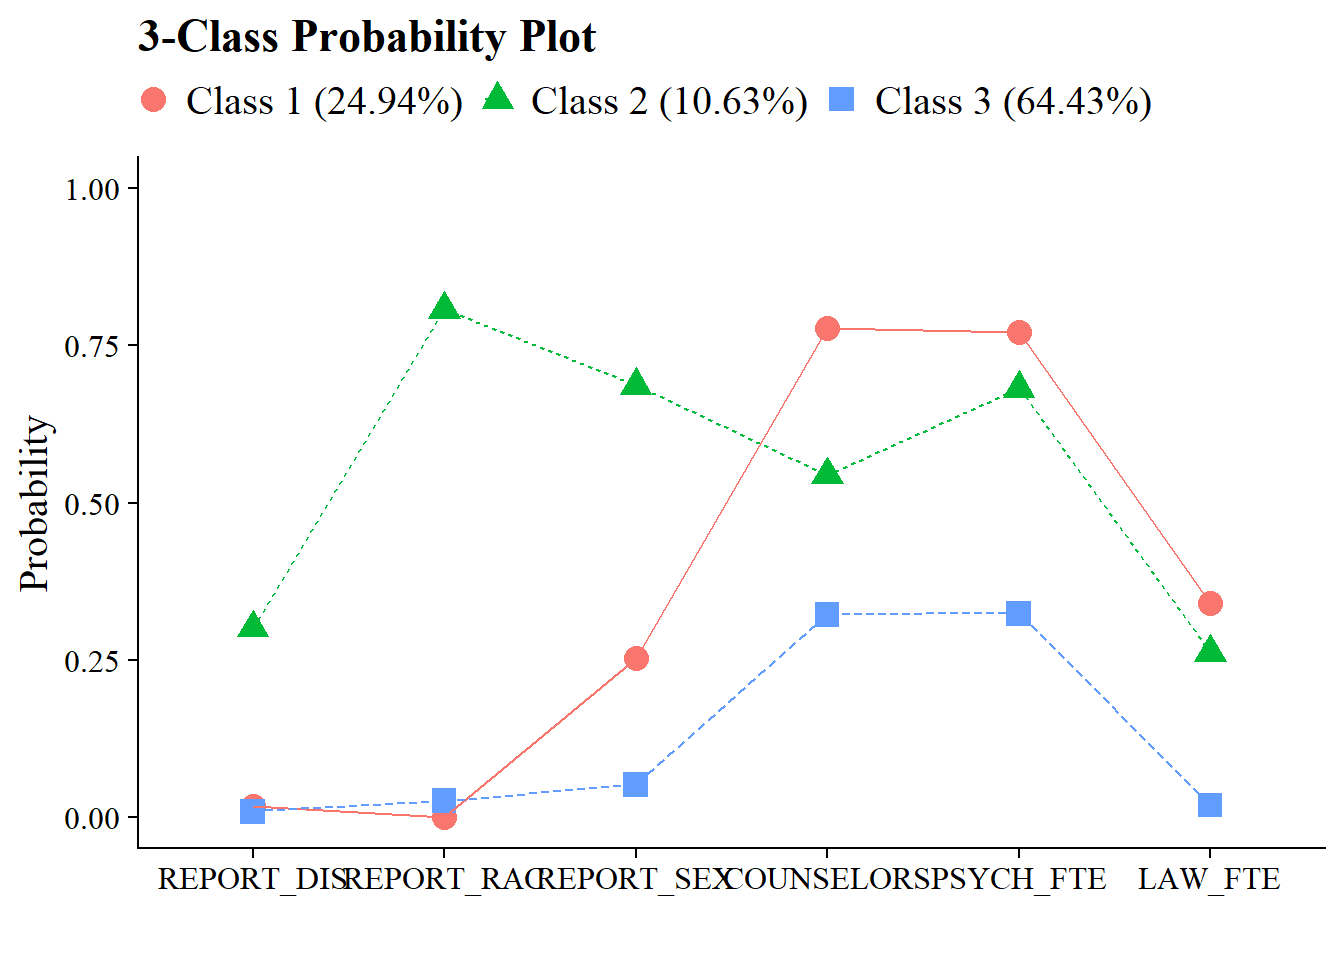
Save figure: